
Pedro Camargo, Ph.D.
Tuesday, March 31, 2020
AequilibraE and Google OR-Tools
I have been using the routing tools inside Google OR-Tools for quite a while now, and I must say that it behaves incredibly well in most cases I tested. The procedures there are not the best you will find in the Operations Research world (neither in time nor in objective function results), but they are incredibly easy to set up and use.
The first time I used it was for the development of a vehicle dispatcher to model services provided by Transportation Network Companies (TNC) such as Uber, Didi & Lyft. At that time, it was quite easy to start from the example code provided by Google and use AequilibraE for the computation of network-based distance matrices (for distances, travel time or other metrics of interest)
I have failed, however, to post some of that work here, which I decided to do with the little free time I had last weekend (this was under review until the time I posted). For this little demonstration, I used the AequilibraE’s standard Chicago Regional model example and Geopandas/Folium for wrangling and plotting all the data in a Jupyter Notebook. And it looks pretty nice, but this is one of those cases when putting the code here is not convenient, so it is on gist on GitHub for you to check it out. The result, however, is pretty cool.
OK. But what about those of us who don’t know how to program? I know the best we can do is to push them (frequently) to learn it, but this does look like something that we would bring to the QGIS plugin. Doesn’t it? Wait!! It was already on the roadmap!!
The problem with integrating most routing procedures into AequilibraE for QGIS, however, lies in the virtually unlimited number of problem configurations one can have on a real-world routing problem and on the substantial number of parameters most algorithms have (including Google OR-Tools). Creating a GUI, and translating those parameters into code, become a daunting (and possibly vain) task.
Nonetheless, making a minimal set of resources available for AequilibraE/QGIS users seemed like a decent enough idea, so I implemented those exact resources on AequilibraE’s newest version for QGIS (experimental), which should hit the QGIS plugin repository in the next week or so.
The GUI (below) is extremely basic and does not allow the user to change any of the Google OR-Tools parameters, but works like a charm.
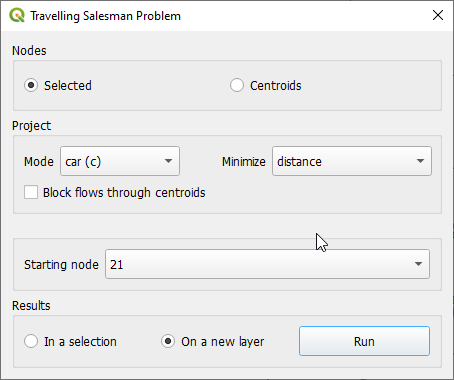
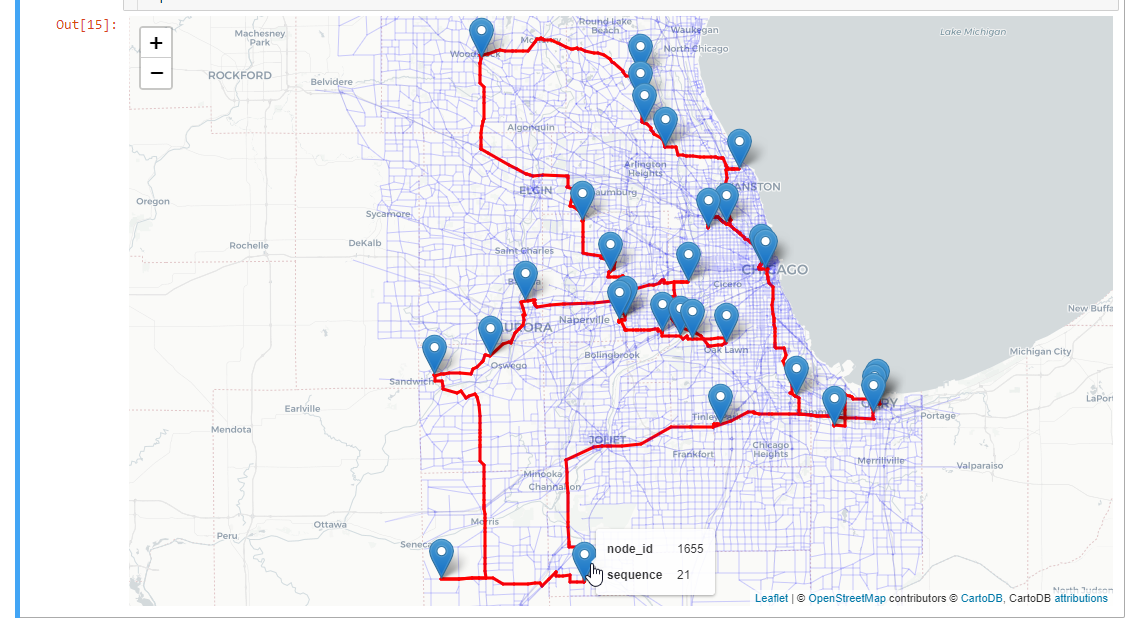
Besides allowing for non-programmers to use this new feature, the QGIS interface also allows for a much nicer automatic formatting of the final route (if I know how to make nice looking maps, of course). The AequilibraE standard reporting GUI also returns the route and the objective function value, which is always nice.
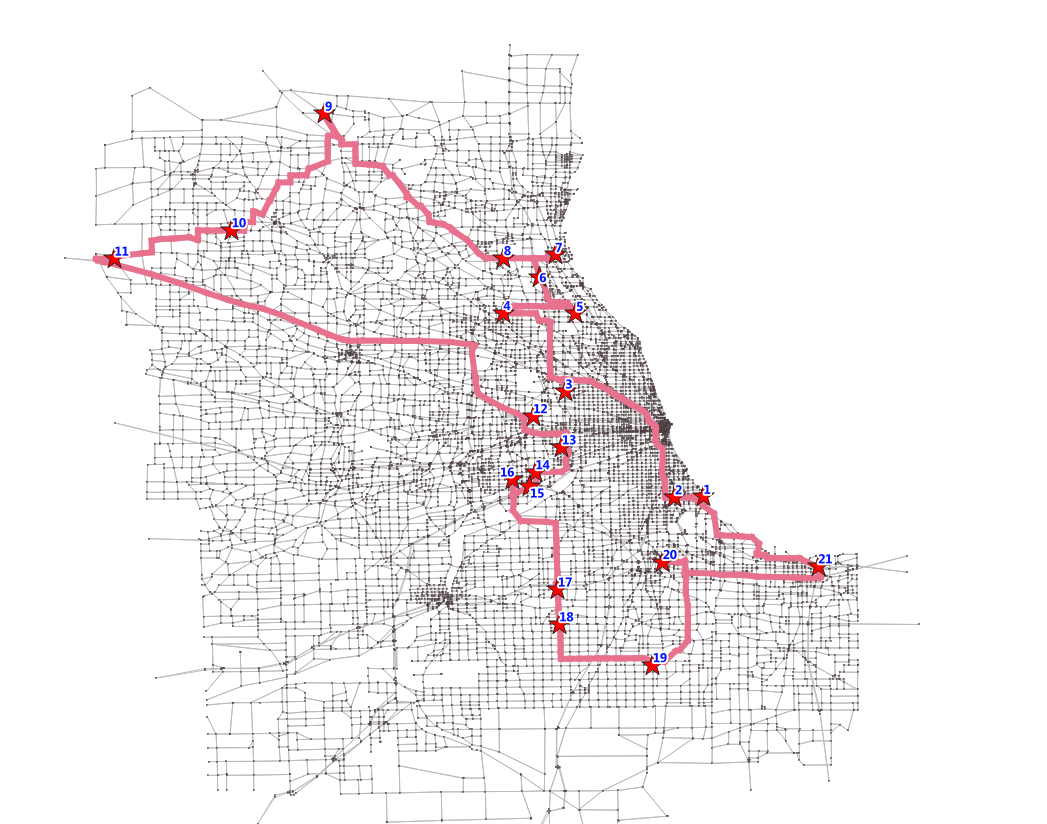
The last thing I built into the QGIS result is a field with the position of each node in the sequence of visits, but only if you choose to put the results in new layers, which allows to label the resulting map as I did below for an arbitrary set of 21 nodes for the Chicago Regional Model.
Installation
If you are on MacOS or Linux, installing Google OR-Tools directly on your system Python should solve enable the AequilibraE routing menu, but on Windows you will have to follow the step-by-step installation instruction or check this video out.