Pedro Camargo, Ph.D.
Monday, July 23, 2018
A little more Delaunay Lines
It has been nearly 4.5 years since I published my idea on making desire lines using Delaunay Triangles on this blog, over 3.5 years I launched AequilibraE and about 2 years since I incorporated Delaunay Lines into AequilibraE (and made it actually usable).
I have presented this concept in conferences (ATRF, TRB Modeling Aplications, and TRB annual meeting) however, that helped spread the word on AequilibraE and its capabilities. And although I have seen a steady increase in interest in AequilibraE’s capabilities and its use in academic and professional environments, there are two facts that I think are noteworthy.
The first one is that for the first time, there are people in the transportation community blogging about AequilibraE. The second fact, however, is something that I have wanted to share for a while:
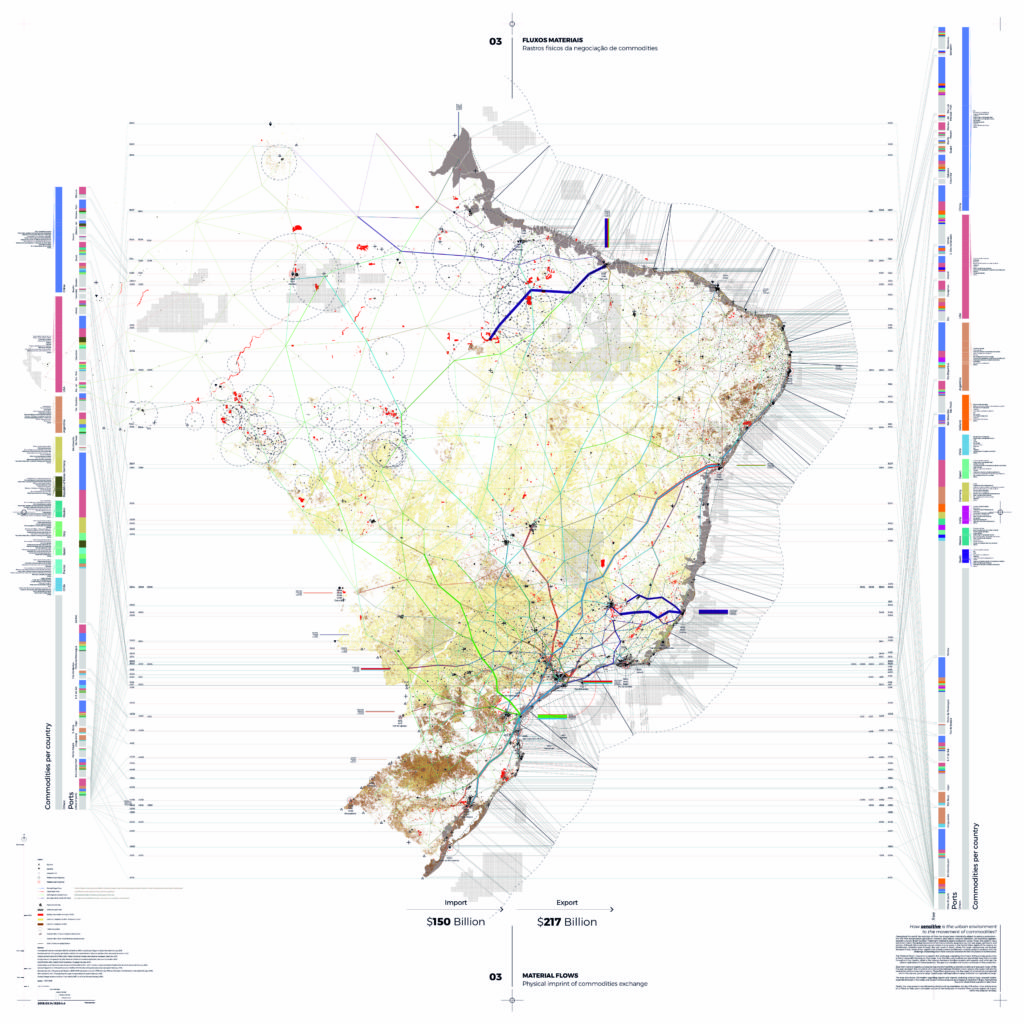
There is a 3m x 3m map based on Delaunay Lines in the “Pavilion of Brazil at the Biennale Architettura 2018” in Venice, Italy. Does anyone have any idea on how stoked I am with that? More than that, I prepared the geographic flow data this map is based on. And to think I used to make fun of architects when I was in Civil Engineering School… 🙂
The map, which is a phenomenal piece of art, was developed by a Brazilian architectural group, and it is one of 10 murals depicting different aspects of the natural and urban environments of Brazil. Although my Delaunay Lines are just a piece of the map, I can;t help by being really proud of it. The Brazilian pavilion, where these maps/murals are presented, has also been mentioned in the media quite a bit (1, 2, 3, 4, 5), including the prestigious The Guardian, which features a picture of a person looking at “my map”!!!.
Again, I am beyond stoked, but I will let you judge by yourselves. You can even download the High-resolution version, and a little text by the authors of the pavilion here (in Portuguese).